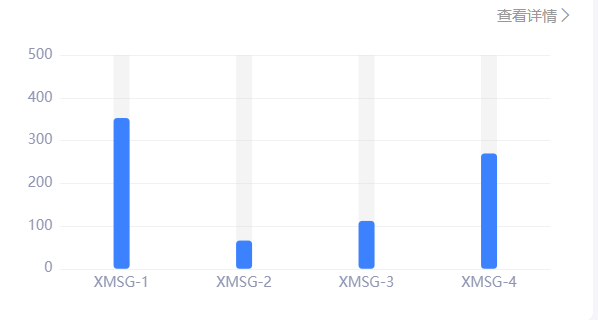
之前做柱状图背景色都是用两个重叠的方法,原来可以直接设置 barMaxWidth: ‘auto’,
showBackground: true,
series: [{
data: [353, 66, 112, 270, 315, 418, 500],
type: ‘bar’,
barMaxWidth: ‘auto’,
showBackground: true,
backgroundStyle: {
color: ‘rgba(220, 220, 220, 0.3)’
},
barWidth: 16,
itemStyle: {
normal: {
color: ‘#3c82fe’,
barBorderRadius: [4, 4, 4, 4],
}
},
label: {
show: false,
// position: ‘top’,
// distance: 10,
// color: ‘#fff’
},
},
{
data: [241, 432, 342, 500, 500, 500, 500],
type: ‘bar’,
barMaxWidth: ‘auto’,
showBackground: true,
backgroundStyle: {
color: ‘rgba(220, 220, 220, 0.3)’
},
barWidth: 16,
itemStyle: {
normal: {
color: ‘#22ba7d’,
barBorderRadius: [4, 4, 4, 4],
}
},
},
],
