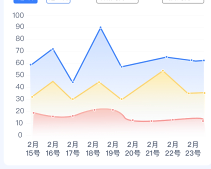
uniapp 使用 echart 折线图 用到组件qiun-data-charts 样式需要在 opts= ” ” 设置具体可参考组件说明文档
<view class="charts-box">
	<qiun-data-charts type="area" :opts="{padding: [15,10,0,10],dataLabel:false,xAxis: {'rotateLabel': true,},legend: {'lineHeight':40,},extra:{area:{type:'curve',addLine:true,gradient:true}}}" :chartData="chartDataA" background="none" />
</view>
chartDataA: {
	"categories": ["2月15号 ", "2月15号 ", "2月15号 ", "2月15号 ", "2月15号 ", "2月15号 ", "2月15号 ", "2月15号 "],
	"series": [{
		"name": "下游商户",
		"data": [35, 8, 25, 37, 4, 20, 37, 4, 20]
	}, {
		"name": "消息直通数",
		"data": [70, 40, 65, 100, 44, 68, 100, 44, 68]
	}, {
		"name": "已发消息数",
		"data": [100, 80, 95, 150, 112, 132, 150, 112, 132]
	}]
},